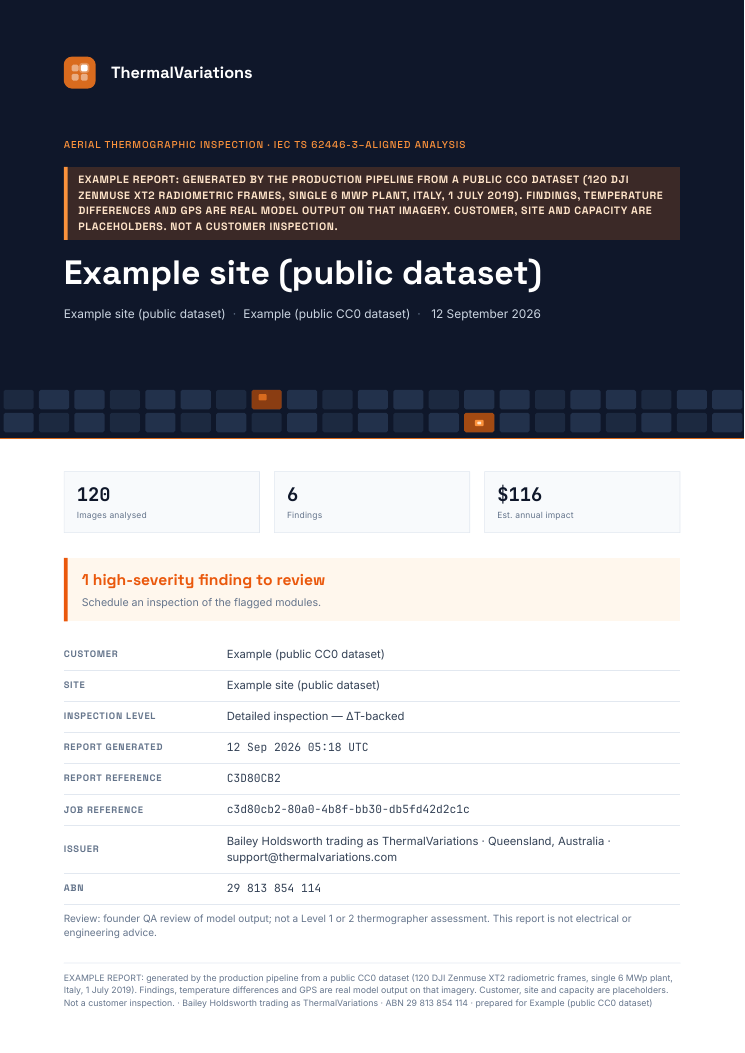
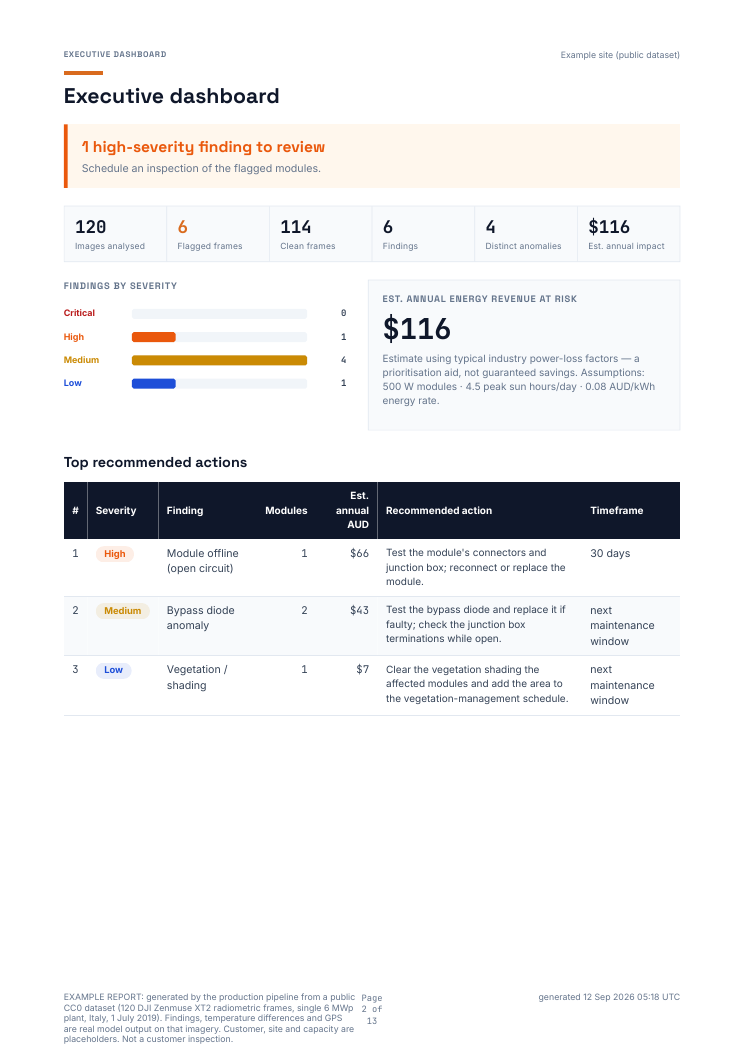
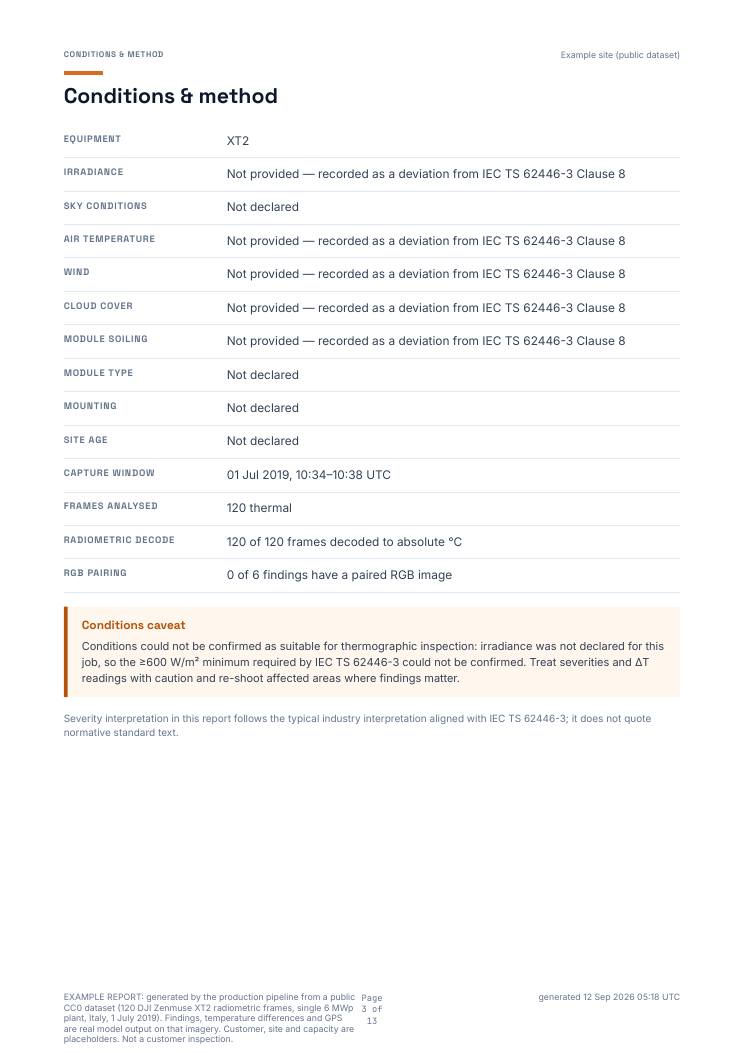
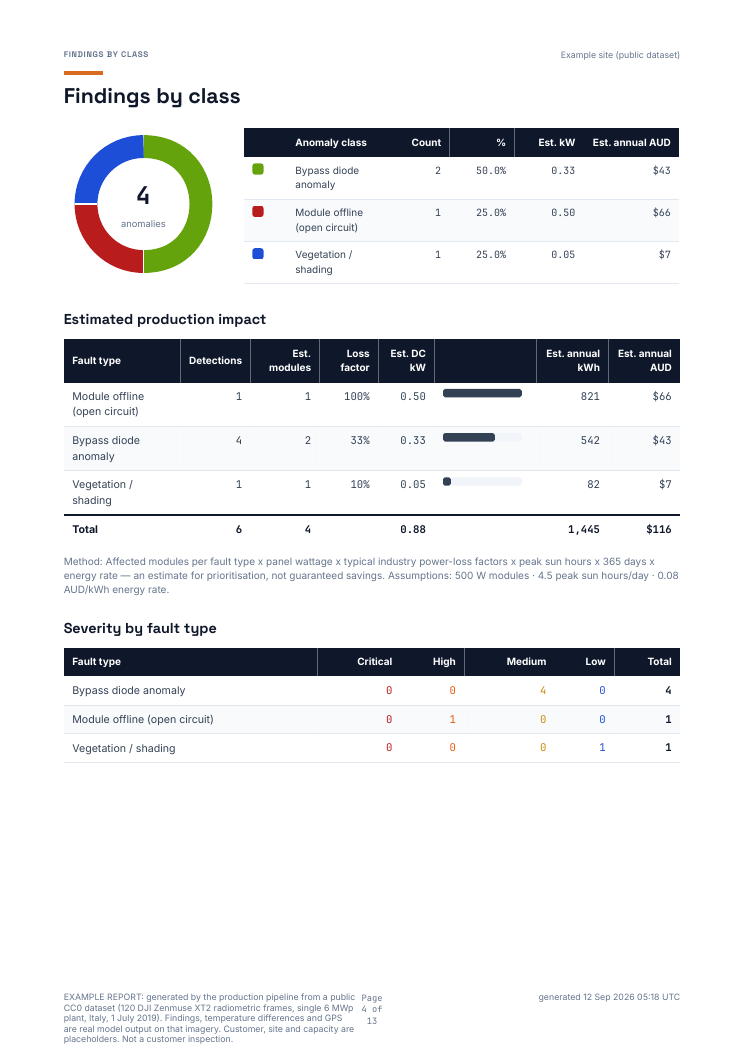
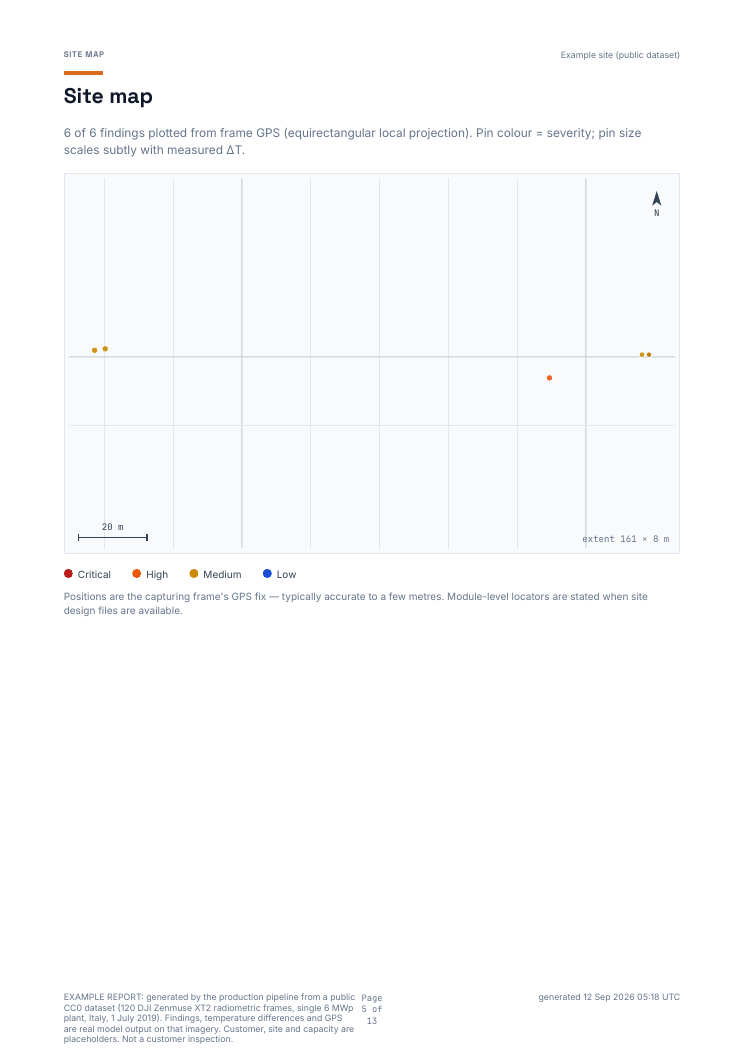
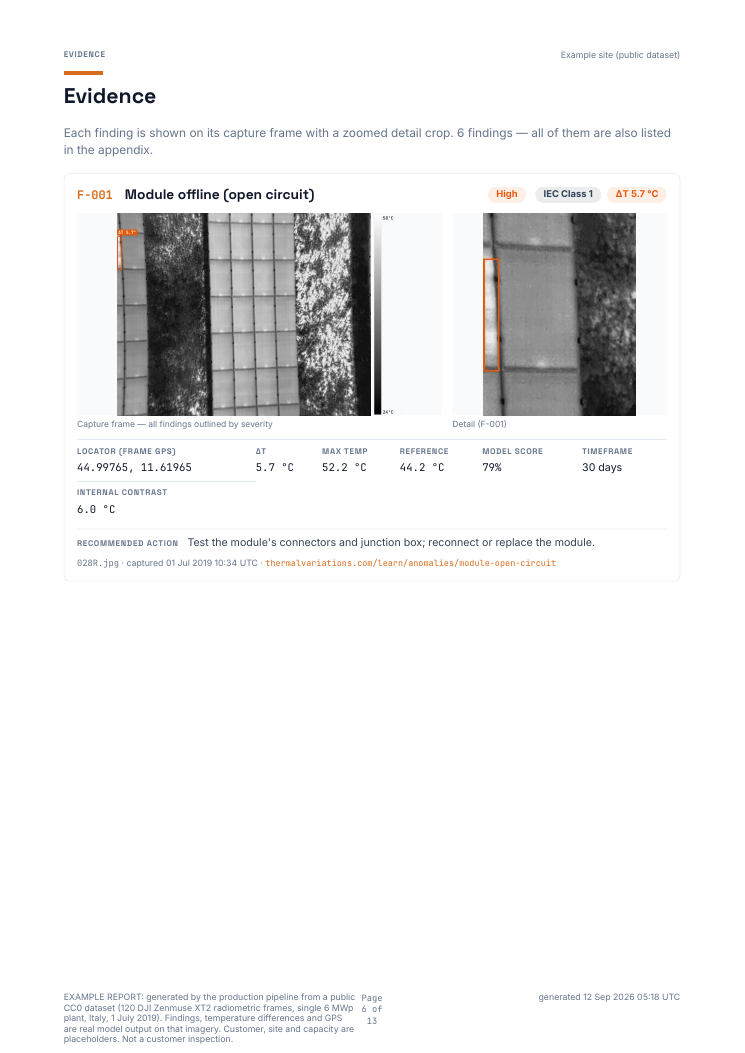
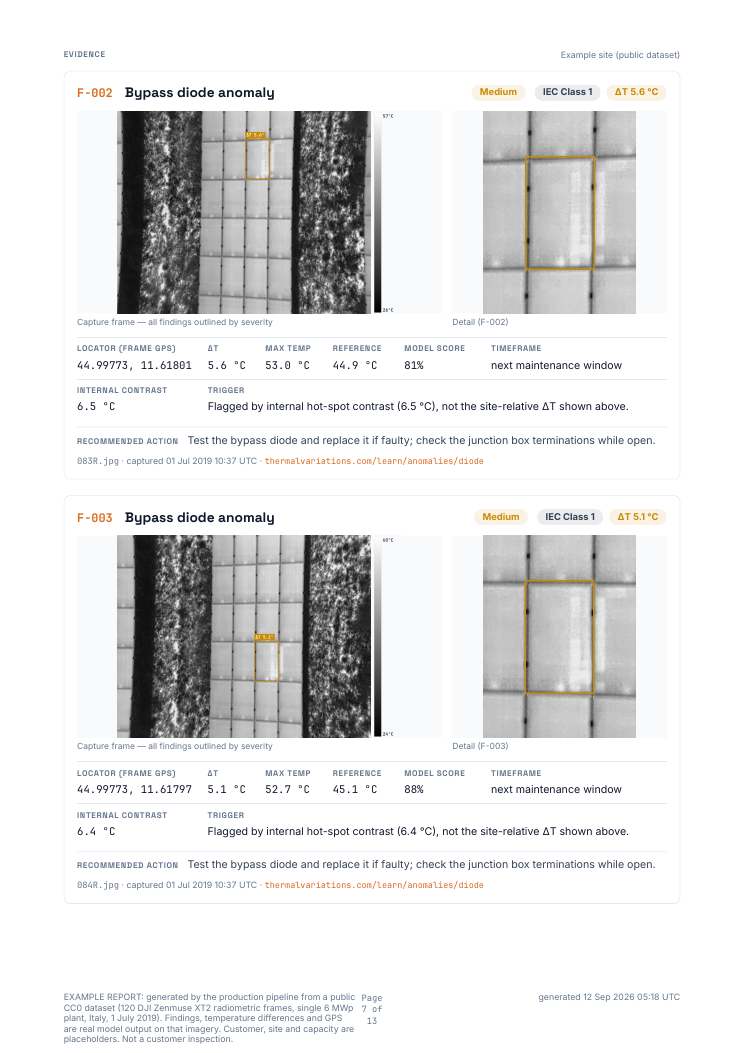
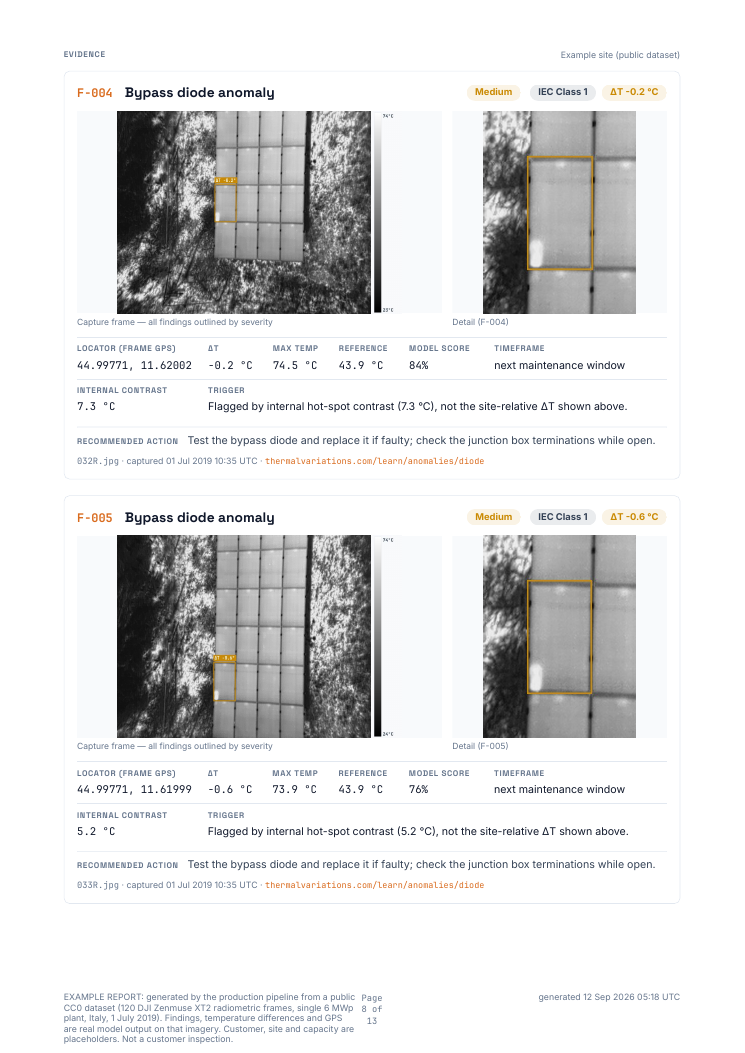
Example report, generated by the production pipeline from a public CC0 dataset: 120 DJI Zenmuse XT2 radiometric frames over a single 6 MWp plant, Italy, 1 July 2019. Findings, dT values and GPS are real model output on that imagery; customer, site and capacity are placeholders.
Your report is generated from your own flight. The dataset is small and a single strip of one plant, so the example has few findings; it is here to show the format and the honesty of the output, not to impress with numbers.
Page previews
Page 1Page 2Page 3Page 4Page 5Page 6Page 7Page 8
What is in every report
Cover and verdict
Site, capture window, frame counts and the headline verdict.
Conditions and method
Irradiance, decode path, thermal GSD, coverage, and every capture check applied.
Severity summary
Findings by grade and class, with the recommended action and timeframe for each.
Finding evidence
One card per finding: thermal crop, ΔT where measured, GPS of the source frame, provenance.
Capture issues
Frames that failed a check, why, and which findings were suppressed as a result.
Limitations
What the analysis did not measure, in plain language.
Findings without a measured ΔT are labelled “suspected (pattern-based)”. Classes that miss their validation bar ship marked “suspected, under validation”. See what we have measured.