Aerial thermal faults
on your solar site, graded and ranked.
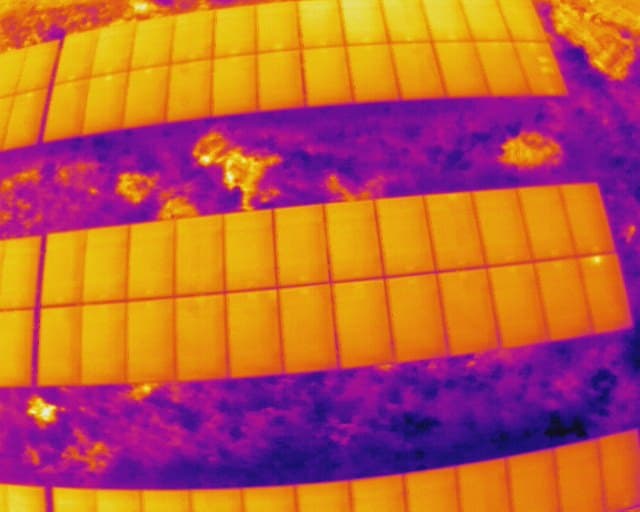
ThermalVariations turns your aerial thermal drone imagery into a severity-ranked PV fault report for an entire solar site. Hotspots, bypass-diode faults and offline modules, flagged and graded - aligned to IEC TS 62446-3, with your imagery stored in AWS Sydney. You fly the drone; we do the thermography analysis.
Encrypted uploads · Private per-customer storage · Imagery stored in AWS Sydney
Measured on one public dataset, not yet site-validated. Method and limits on the validation page.
From a folder of frames to a punch list
A utility-scale solar farm produces thousands of thermal frames per flight. Our solar thermography analysis reads every frame and surfaces only the modules that need attention — drone solar panel inspection without the manual review.
Module-level fault detection
The model localises every module in the frame, gates on measured thermal-outlier behaviour, then types the flagged ones - so a whole-array scan returns a short list, not a wall of false positives.
Severity triage
Findings are graded critical, high, medium or low so your O&M team starts where the lost yield is largest.
Bad frames do not become bad findings
Every frame is checked for the six capture problems that produce false faults: irradiance below 600 W/m², off-nadir angle, sun glint, blur, low thermal contrast and non-thermal files. Findings on frames that fail a check are marked unverified and kept out of the headline counts.
Reports built to hand to a contractor
A shareable PDF with flagged thumbnails, a severity summary, and a recommended action and fix timeframe for every finding. Findings export as CSV, GeoJSON and KML for your CMMS or GIS.
Three steps between flight and fix
Scope the inspection
Tell us the site size in panels and wattage. Your fixed quote is generated instantly: no calls, no waiting.
Upload the flight
Drag your thermal imagery in. Uploads are encrypted and sent in chunks, built for multi-gigabyte batches (up to 20 GB per inspection) over patchy site connections. The intake check tells you whether your files are radiometric before you pay.
Act on the report
The model grades every frame and delivers a severity-ranked PDF with flagged thumbnails. Progress shows in your dashboard and the report appears there the moment analysis finishes.
Thermal imaging is indicative rather than diagnostic. The report tells your team exactly which modules to verify on site, so always confirm flagged modules in person before repair work.
Built for the people who keep solar producing
Protect the yield of every site you operate
- Catch under-performing strings and modules before they hit revenue
- Keep every inspection, report and finding for a site in one place
- Hand contractors a prioritised, evidence-backed punch list
Turn thermal flights into a finished deliverable
- Upload captured imagery straight after the flight
- Add automated fault analysis to your service offering
- Deliver severity-ranked reports your clients can act on
One rate. Quoted instantly.
No discovery calls and no opaque tiers. Tell us the size of the site and your fixed quote appears before you commit to anything.
- 20% deposit to start, balance on report delivery
- Quote generated the moment you enter your panel count
- Custom quotes for sites above 1,500 MW
Per megawatt inspected
$75 AUD ex GST
$500 minimum per inspection, ex GST
Designed for sites of 20 MW and above; smaller sites are quoted at the minimum.
Request a trialEstimate your inspection · Sign in if you already have an account.
Your imagery stays yours
Site imagery is commercially sensitive. The platform is built so that it never has to leave your control.
Encrypted end to end
Every image travels over TLS and is stored encrypted at rest in AWS S3. Report downloads use short-lived signed links.
Private to you
Imagery is isolated per customer. Nothing is shared, sold, or used to train shared models. You stay in control of your data.
Australian data storage
Imagery and reports are stored in Amazon S3 in the AWS Sydney (ap-southeast-2) region, and sign-in is handled by AWS Cognito in the same region. Automated analysis runs on our application platform (Render) and the web tier on Vercel, which may execute outside Australia; the source of record stays in the Sydney bucket.
Read our privacy policy and terms of service.
Solar thermal inspection, answered
What is solar thermography?
Solar thermography uses thermal (infrared) imaging to find faults in photovoltaic panels. Faulty cells, diodes and connections run hotter or cooler than healthy ones, so a thermal camera flown over a site reveals problems that are invisible in normal light.
Do you fly the drone, or do I?
You fly. ThermalVariations is an analysis-only service: you capture the aerial thermal imagery of your solar site and upload it, and our analysis returns a severity-ranked fault report. You can use your own drone team or any aerial survey operator.
Is the analysis aligned to IEC TS 62446-3?
Yes. Our fault taxonomy and reporting follow the categories described in IEC TS 62446-3, the international technical specification for outdoor infrared thermography of PV modules and plants. Thermal imaging is indicative, not diagnostic - always confirm flagged modules on site before repair work.
What faults does the analysis flag?
Today the analysis flags eight classes: hotspots, multi-hotspots, bypass-diode anomalies, double-bypassed substrings, offline (open-circuit) modules, cracked cells, soiling, and vegetation or shading. Each finding is graded critical, high, medium or low. The report is written in the full 17-class IEC-style taxonomy, but the other nine classes are reference material we do not currently flag. Measured detection performance, with its limits, is published separately. See what we have measured.
How much does a solar farm thermal inspection cost?
Pricing is fixed and instant: AUD $75 per megawatt inspected ex GST, with an AUD $500 minimum per inspection ex GST. You enter your site size and the quote appears immediately - no discovery calls. A deposit of at least 20% starts the job and the balance is due on report delivery.
How fast is the report?
After your imagery finishes uploading, the model grades every thermal frame and delivers a severity-ranked PDF report with flagged module thumbnails. Progress shows in your dashboard and the report appears there as soon as analysis finishes. We have not yet measured turnaround at utility scale, so we do not publish a time.
Where is my imagery stored, and who can see it?
All imagery and reports are stored in Amazon S3 in the AWS Sydney (ap-southeast-2) region, and sign-in runs on AWS Cognito in the same region. Automated analysis runs on our application platform (Render) and the web tier on Vercel, which may execute outside Australia; the source of record stays in the Sydney bucket. Data is encrypted in transit and at rest, isolated per customer, and never shared with other customers or used to train shared models.
What do I need to upload?
Your aerial thermal drone imagery of the solar site, plus the site size (panel count and wattage) used to generate your fixed quote. Uploads are encrypted and sent in chunks, built for multi-gigabyte batches (up to 20 GB per inspection) over patchy on-site connections.
The next fault is already on your site. Find it first.
Download the sample report, or get your fixed quote in 30 seconds. The first inspection for a new site runs as a trial inspection.